Knowledge is essential to human culture. Systems of belief, understanding of oneself, one’s group, and information about the world is encoded in language and transmitted across generations. Over time, knowledge accumulates and aggregates, to the point that traditional mechanisms of transmission—in speech, song, and reenactment (oral tradition)—are insufficient to preserve and transmit cultural knowledge. A bottleneck forms.
The human solution, which is now believed to have arisen independently in a number of cultures (Mesopotamia, Egypt, China, Mesoamerica) was a technological one: to reduce knowledge to information in the form of writing. It was and remains an extraordinary innovation. As the technology spread and literacy gradually increased, information accumulated and aggregated, creating a new bottleneck in need of new solutions.
From a certain perspective, we can look at human history as an unending effort to create, record, and store information in order to disseminate cultural knowledge. New technologies were (and continue to be) developed to organize and catalog information so that it can be retrieved. Information unorganized is knowledge lost.
Knowledge graphs stand in a long line of human innovation: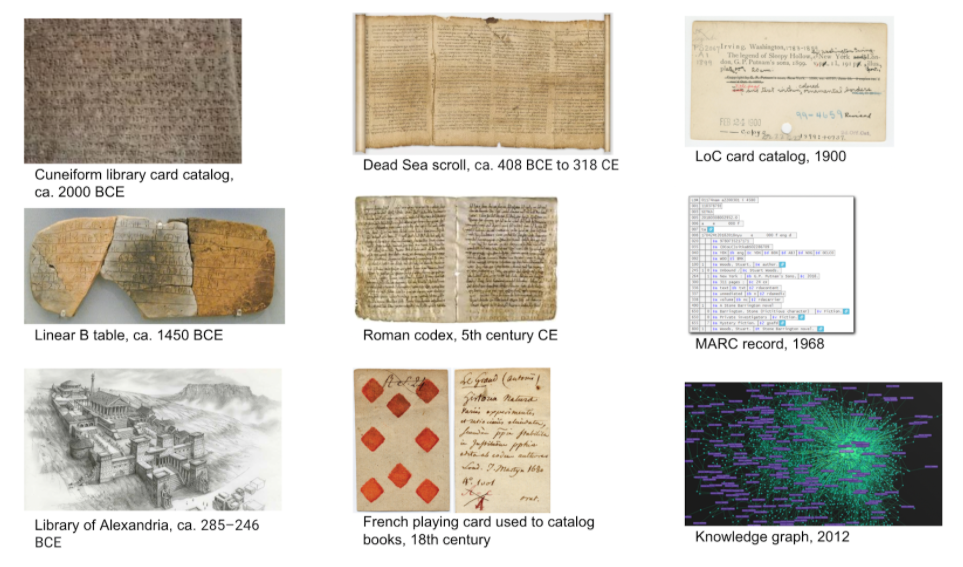

- 3500 BCE: Written language
- 1790 BCE: Code of Hammurabi
- 500 BCE: Egyptian papyrus rolls (scrolls)
- 300s BCE: Library of Alexandria
- 100 CE: Codices
- 1791: The French cataloging code
- 1950s: Computational linguistics
- 1960: Full-text search, hypertext
- 1963: ASCII code
- 1968: MARC records
- 1980s: Neural networks
- 1989: The Web
- 2012: Knowledge graphs
Over the course of 2020, Yewno had the opportunity to participate in multiple webinars and conversations on this very topic. As a provider of artificial intelligence solutions, we knew that the information overload problem could be addressed using knowledge graphs, but we were curious to see what academics and practitioners were saying. We learned that there is growing awareness that current taxonomies need to move beyond not only keywords, but even the next-generation natural language processing (NLP) because of the need for more thorough disambiguation of terms, metaphors and colloquialisms, as well as and the need to relate ideas to one another.
Increasingly, knowledge graphs have been growing in popularity for the management of all types of data, due to their dynamic, non-linear nature. They can expand to include new information, and billions of data points can be connected and interconnected depending on what types of information are being queried and recalled. Essentially, it is like storing information in 3D. Today’s news can now be surfaced alongside a research article written 15 years ago, because the concepts within the two are identified in the knowledge graph as being relevant. In this way, publishers can now see their content in context - with current news, with other titles in their own collection, and with the broader research ecosystem.